The bottled water represents 25% of total beverage consumption in the United States. Pair that with steadily increasing international sales, the drink is positioned for even greater dominance as a category leader. But there’s also growing headwinds and louder criticism in this industry that’s blamed for over 100 million bottles of waste per year.
With more sales, comes more waste. And that’s a bummer for an essential product like this! As this segment of the beverage market continues to grow, industry leaders will need to find ways to reduce or eliminate the amount of total waste from their product. Beverage companies have already developed proactive solutions like reducing the amount of plastic needed per bottle and encouraging recycling. But is this enough? In our industry report, we look at the data and predict where the industry is headed next.
The Bottled Water Industry Statistics
More than 100 million plastic water bottles are used each year in the United States.
The world population is expected to grow from 7.8 billion to about 9.8 billion by the year 2050. Similarly, the demand for safe drinking water is expected to coincide with the population boom. (PR Newswire)
According to a poll, 89% said that they consumed bottled water while traveling. (Beverage Industry)
In a Harris poll that was organized for IBWA, 94% of Americans regarded bottled water as a healthier alternative from carbonated soft drinks (CSD), and 93% said that they want bottled water frequently available along with other beverages. (BeverageDaily.com)
The U.S. bottled water sales volume reached a ballpark figure of 13.85 billion gallons last 2018. (Statista)
According to a bottled water market report from The Business Research Company, the global bottled market rose to beyond $200 billion coming from a 9% annual growth from 2014 to 2017. The rising concern with various health problems caused by contaminated water consumption is seen as the reason for this growth. (MarketReseach.com)
Making up more than 65% of the demand, still water represents the largest sub-segment of bottled water followed by carbonated water. (BusinessWire)
In 2016, convenience store volume amounted close to 41,000. (Grand View Research)
The per capita water consumption is expected to rise within 5 to 8 liters per day, in the context of undeniable evidence of proper hydration benefits. (PR Newswire)
Global bottled water consumption is currently at 391 billion liters. (Statista)
Related Reading: 101 Bottled Water Company Name Ideas
The U.S. Bottled Water Market
Global water sales could reach over 300 billion in annual sales.
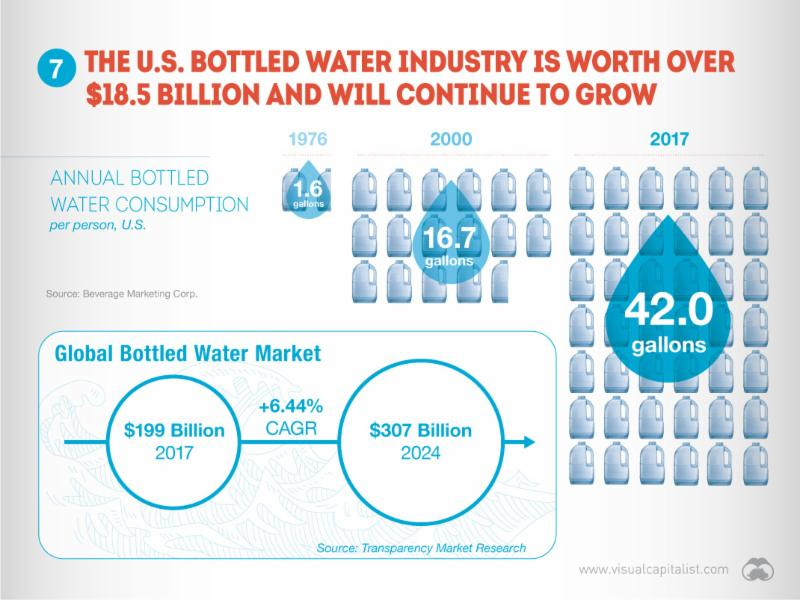
The U.S. bottled water per capita consumption was at its peak in 2018 with 42.3 gallons. (Statista)
The total volume of bottled water hit 13.7 billion gallons in 2017, which was a surge of 7% compared to the previous year. (IBWA)
The bottled water per capita consumption of America has surpassed 42 gallons, gaining critical ground from CSDs which was at 37.5 gallons. (Beverage Daily)
The United States bottled water market is expected to raise monetary opportunities of more than $6 billion by the year 2024 from 2016. (Persistence Market Research)
Americans have raised their bottled water yearly consumption by more than 13 gallons from 29 gallons per person in 2007 to about 42.1 gallons in 2017. (IBWA)
In a study, domestic sparkling water rose 27.5%; local non-sparkling water increased by 5.5%; home and office delivery (or 3 and 5-gallon size bottles) surged 1.3%, while imported water was up 9.2%. (BeverageDaily.com)
The others segment distribution channel is anticipated to continue its U.S. bottled water market dominance within the forecast period of 2016 through 2024. A value share of 38.3% with a CAGR of 4.1% is expected by the year 2024. (Persistence Market Research)
The International Bottled Water Association (IBWA) stated in January last year that over 7 out of 10 Americans or roughly 72% expressed still, bottled water, and sparkling water are their choices of non-alcoholic beverages. (Beverage Industry)
By the end of 2024, it is estimated that the supermarket segment will make up for about 35.3% of the value share among the distribution channels. (Persistence Market Research)
Global Bottled Water Data
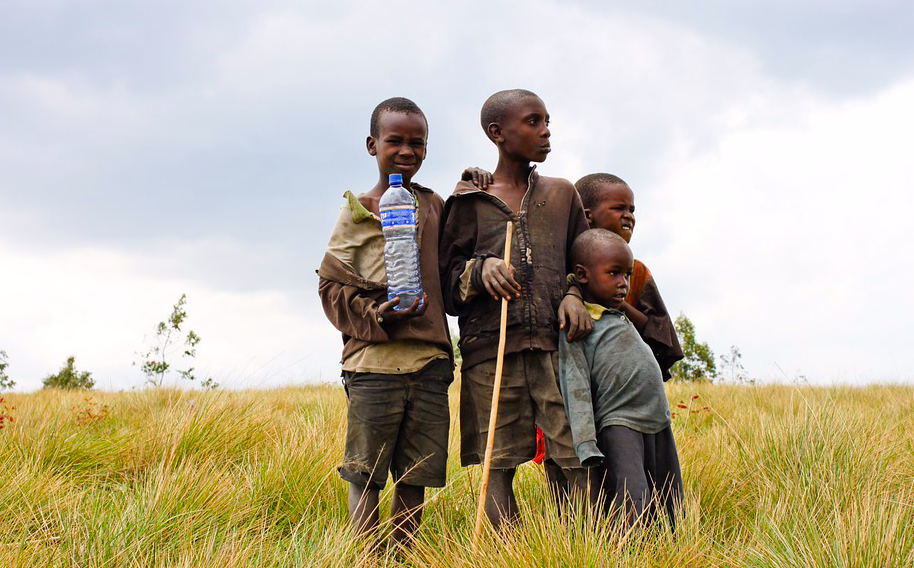
Bottled provides safe and clean water where it might be unavailable otherwise.
In 2015, the bottled water industry was worth $185 billion and is projected to hit $334 billion by 2023 with a CAGR of 8.5% in the course of the forecast period between 2018 to 2023. (BusinessWire)
By 2021, the bottled water expenditure of global per capita average is expected to develop, growing from $32.3 per person in 2017 to about $45.3 in 2021. (Market Research)
The top players in the industry such as PepsiCo Inc., Danone Waters of America, Inc., Nestlé S.A., and Bisleri International Pvt. Ltd. retain their own water sources such as springs and lakes. (Grand View Research)
Europe, the United States, and China are among the largest bottled water markets in the world with a combined market share of 60%. (PR Newswire)
China made up over a quarter of the world’s bottled water total volume in 2017. (IBWA)
The entry into developing markets as well as product innovations with minimal environmental and health hazard is determined to be primary opportunities in the bottled water industry. (BusinessWire)
Making up about 38% of the market share in 2016, the mineral water segment is anticipated to grow with a robust CAGR in the next few years. (Grand View Research)
The Asia Pacific region had topped the bottled water consumption in 2017, encompassing 42% of the total global consumption. (Market Research)
About 93% of poll respondents said that bottled water must be available in any place other beverages are sold. (Beverage Industry)
Waste Statistics
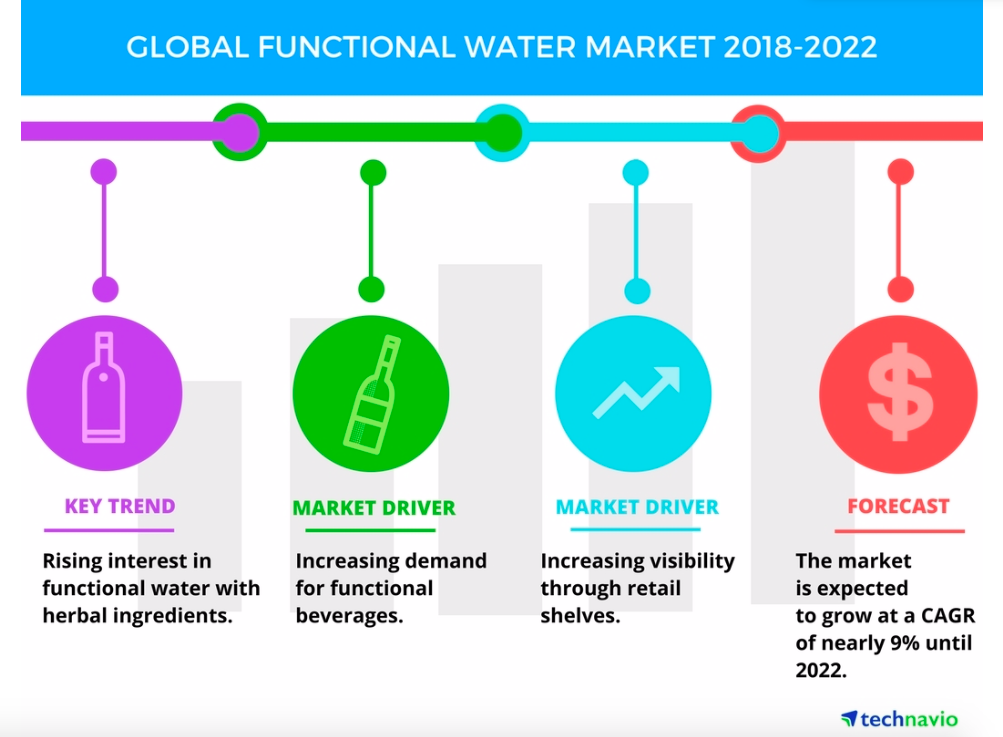
Key growth trends in the global water market.
Bottled water isn’t great for the environment. According to industry reports, 80% of all water bottles end up in a landfill. Only one in every five bottles is currently being recycled. Depressing statistics like this encourages consumers to use at home water filtration as an alternative.
- A bottle of water takes an estimated 700 years to start decomposing. (The World Counts)
- More than 100 million plastic water bottles are used per year. (The World Counts)
- Landfills in the United States contain over 2 million of these plastic bottles. (TheWaterProject.org)
- 17 million barrels of oil are needed to produce water bottles annually in the United States. (Harvard.edu)
- Tap water is much more affordable than bottled water. Average cost per gallon of tap water is $.02. The average cost per gallon of bottled water is $0.64. (Harvard.edu)
Industry Predictions
Yes. We can all agree plastic bottles are bad for the environment. No getting around that. But mass produced disposable water are also a must have in areas where water might be inaccessible or temporarily unavailable due to a natural disaster.
When a temporary crisis hits having fresh water available can be the difference between life and death. A person can survive without food for days but we cannot survive without water for a maximum of three days. Bottom line is that bottle water is an absolute necessity even if there are longer-term environmental considerations.
Despite all of this bottled water companies will need to come up with a way to make bottle reusable or 100% biodegradable. The company who can successfully execute on this differentiators will see success.
We predict overall consumption and sales for this product to grow in the next decade. There is a revolution for more nutritional sustenance and consumers have looked for beverages with less sugar. Retail bottled water provides hydration that every human needs without adding calories or unwanted additives.
The biggest threat we see in the bottled water industry comes from filtration companies that can provide a less expensive product, while still offering a high-level of convince. The easier to use, more affordable, and higher quality these filtration solutions become the wider the adoption will be from consumers who want to reduce waste.


